Welcome to the user page of Crossover1370!
I am a software engineer based in Goleta, California, United States. I am interested in mathematics, computer science, engineering, geography, and sports. I joined Wikipedia on July 30, 2019, just before my sophomore year of high school in nearby Santa Clarita.
My edits mostly consist of articles related to sports, geography (especially southern California geography), math, and science. Sometimes I contribute to articles on current events.
Education
edit- Saugus High School (2018-2022)
- University of California, Santa Barbara (2022-present)
Articles I have created
edit- Template:Santa Clarita (January 8, 2020)
- Castaic High School (December 23, 2020)
- Acton-Agua Dulce Unified School District (December 24, 2020)
- List of people from Santa Clarita, California (February 27, 2021)
- Santa Clarita Christian School (April 27, 2021)
- Portal:Basketball (June 18, 2021) - deleted in 2019 and recovered in 2021
- Timothy Canham (May 29, 2022)
- Draft:Tau (mathematical constant) (May 16, 2024)
- Module:Color temperature (April 30, 2026)
- I also updated Template:Color temperature to use the formulas in the module.
Articles I have contributed substantially to
edit- Santa Clarita, California (wrote about 70% of the article)
- Santa Clarita neighborhood articles:
- Several articles on Template:Santa Clarita
Userboxes
edit| ♂ | This contributor to Wikipedia is male. |
 | This user has been an extended confirmed user since April 12, 2020. (verify) |
| This editor is a Yeoman Editor and is entitled to display this Service Badge. |
| This user is a runner. |
| This user is an undergraduate student majoring in computer science. |
Gallery
edit Periodic table, not highlighted
 2016 U.S. presidential election margins, by state
 Color circle
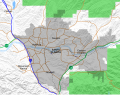 Santa Clarita, CA location map
 2020 U.S. presidential election margins, by state
 Walk of Western Stars, Santa Clarita, CA
 Unit circle with coordinates corresponding to cosine (x) and sine (y).
 Graph of body temperature throughout the day
 College of the Canyons Performing Arts Center
 Map of the United States shaded by population density (2020 census)
 Map of the 2020 United States presidential election by county
 Population growth from 2010 to 2020, by U.S. state. (Originally uploaded by Oogle12; I changed color scheme and added legend.)
 US states by average altitude
 Countries and territories by average altitude
 U.S. state population density maps, 2020 census (for all maps see Wikimedia Commons)


.svg)


