Half of Hastings Borough Council in East Sussex, England is elected every two years, while before 2002 the council was elected by thirds. Since the last boundary changes in 2002, 32 councillors have been elected from 16 wards.[1] The Council was held by the Labour Party from 2010 [2] to 2022 when the elections returned a No Overall Control result, leading the Labour Party to form a coalition with the Green Party. This coalition broke down when 6 Labour Councillors resigned from the Labour Party and formed the Hastings Independent Group. Between January 2024 and the May 2024 elections the Council was led by an alliance between the Hastings Independent Group and the Green Party. The 2024 election returned a result of No Overall Control [3] and the Council is now minority led by the Green Party. The 2026 elections resulted in Green control.[4]
Council elections
edit| Year | Conservative | Labour | Liberal Democrats[a] | Green | Independents & Others |
Council control after election | ||
|---|---|---|---|---|---|---|---|---|
| Local government reorganisation; council established (33 seats) | ||||||||
| 1973 | 12 | 11 | 9 | – | 1 | No overall control | ||
| 1976 | 20 | 8 | 4 | 0 | 1 | Conservative | ||
| New ward boundaries (32 seats)[6] | ||||||||
| 1979 | 16 | 8 | 7 | 0 | 1 | Conservative | ||
| 1980 | 15 | 9 | 7 | 0 | 1 | No overall control | ||
| 1982 | 13 | 8 | 10 | 0 | 1 | No overall control | ||
| 1983 | 12 | 9 | 9 | 0 | 2 | No overall control | ||
| 1984 | 13 | 8 | 10 | 0 | 1 | No overall control | ||
| 1986 | 11 | 8 | 13 | 0 | 0 | No overall control | ||
| 1987 | 11 | 7 | 14 | 0 | 0 | No overall control | ||
| 1988 | 12 | 8 | 12 | 0 | 0 | No overall control | ||
| 1990 | 13 | 9 | 9 | 0 | 1 | No overall control | ||
| 1991 | 12 | 10 | 9 | 0 | 1 | No overall control | ||
| 1992 | 14 | 9 | 9 | 0 | 0 | No overall control | ||
| 1994 | 8 | 10 | 12 | 0 | 2 | No overall control | ||
| 1995 | 5 | 12 | 14 | 0 | 1 | No overall control | ||
| 1996 | 0 | 15 | 17 | 0 | 0 | Liberal Democrats | ||
| 1998 | 1 | 18 | 13 | 0 | 0 | Labour | ||
| 1999 | 2 | 18 | 12 | 0 | 0 | Labour | ||
| 2000 | 6 | 18 | 8 | 0 | 0 | Labour | ||
| New ward boundaries (32 seats)[b][7] | ||||||||
| 2002 | 10 | 21 | 1 | 0 | 0 | Labour | ||
| 2004 | 13 | 15 | 4 | 0 | 0 | No overall control | ||
| 2006 | 17 | 10 | 5 | 0 | 0 | Conservative | ||
| 2008 | 15 | 13 | 3 | 0 | 1 | No overall control | ||
| 2010 | 15 | 16 | 1 | 0 | 0 | No overall control | ||
| 2012 | 10 | 22 | 0 | 0 | 0 | Labour | ||
| 2014 | 8 | 24 | 0 | 0 | 0 | Labour | ||
| 2016 | 8 | 24 | 0 | 0 | 0 | Labour | ||
| New ward boundaries (32 seats)[8] | ||||||||
| 2018 | 8 | 24 | 0 | 0 | 0 | Labour | ||
| 2021 | 12 | 19 | 0 | 1 | 0 | Labour | ||
| 2022 | 12 | 15 | 0 | 5 | 0 | No overall control | ||
| 2024 | 5 | 8 | 0 | 12 | 7 | No overall control | ||
| 2026 | 2 | 4 | 0 | 19 | 7 | Green | ||
Borough result maps
edit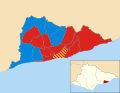 2002 results map
 2004 results map
 2006 results map
 2008 results map
 2010 results map
 2012 results map
 2014 results map
 2016 results map
 2018 results map
 2021 results map
 2022 results map
 2024 results map
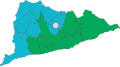 2026 results map


By-election results
edit1994-1998
edit| Party | Candidate | Votes | % | ±% | |
|---|---|---|---|---|---|
| Liberal Democrats | 464 | 47.5 | +5.4 | ||
| Labour | 326 | 33.4 | +0.0 | ||
| Conservative | 104 | 10.6 | −9.8 | ||
| Liberal | 82 | 8.4 | +8.4 | ||
| Majority | 138 | 14.1 | |||
| Turnout | 976 | 27.0 | |||
| Liberal Democrats hold | Swing | ||||
| Party | Candidate | Votes | % | ±% | |
|---|---|---|---|---|---|
| Liberal Democrats | 479 | 40.3 | −11.9 | ||
| Conservative | 438 | 36.8 | +12.5 | ||
| Labour | 272 | 22.9 | −0.7 | ||
| Majority | 41 | 3.5 | |||
| Turnout | 1,189 | 25 | |||
| Liberal Democrats hold | Swing | ||||
1998-2002
edit| Party | Candidate | Votes | % | ±% | |
|---|---|---|---|---|---|
| Labour | 918 | 44.6 | +1.1 | ||
| Conservative | 670 | 32.6 | +17.2 | ||
| Liberal Democrats | 469 | 22.8 | −18.3 | ||
| Majority | 248 | 12.0 | |||
| Turnout | 2,057 | ||||
| Labour hold | Swing | ||||
2002-2006
edit| Party | Candidate | Votes | % | ±% | |
|---|---|---|---|---|---|
| Conservative | Gladys Martin | 504 | 37.6 | −4.4 | |
| Liberal Democrats | Colin Dormer | 294 | 21.9 | −0.7 | |
| Labour | John Ward | 274 | 20.4 | −2.4 | |
| Independent | Robert Harris | 253 | 18.9 | +6.4 | |
| Green | Kevin Young | 17 | 1.3 | +1.3 | |
| Majority | 210 | 15.7 | |||
| Turnout | 1,342 | 34.5 | |||
| Conservative hold | Swing | ||||
2006-2010
edit| Party | Candidate | Votes | % | ±% | |
|---|---|---|---|---|---|
| Labour | Andrew Cartwright | 516 | 34.2 | +8.0 | |
| Conservative | Simon Corello | 475 | 31.5 | −15.7 | |
| Liberal Democrats | Tricia Kennelly | 332 | 22.0 | +2.2 | |
| Green | Sally Phillips | 92 | 6.1 | −0.7 | |
| BNP | John Martin | 55 | 3.6 | +3.6 | |
| UKIP | Mick Turner | 38 | 2.5 | +2.5 | |
| Majority | 41 | 2.7 | |||
| Turnout | 1,508 | 37.8 | |||
| Labour gain from Conservative | Swing | ||||
| Party | Candidate | Votes | % | ±% | |
|---|---|---|---|---|---|
| Labour | Bruce Dowling | 555 | 39.2 | +4.5 | |
| Conservative | Matthew Lock | 482 | 34.1 | −9.1 | |
| Liberal Democrats | Mike Howard | 254 | 18.0 | −4.1 | |
| BNP | Nicholas Prince | 84 | 5.9 | +5.9 | |
| UKIP | Diane Granger | 40 | 2.8 | +2.8 | |
| Majority | 73 | 5.1 | |||
| Turnout | 1,415 | 41.9 | |||
| Labour gain from Conservative | Swing | ||||
| Party | Candidate | Votes | % | ±% | |
|---|---|---|---|---|---|
| Conservative | Simon Corello | 609 | 40.7 | −17.9 | |
| Labour | Michael Ward | 550 | 36.7 | −12.5 | |
| Liberal Democrats | John Tunbridge | 210 | 14.0 | −3.2 | |
| BNP | Stephen Weir | 93 | 6.2 | +6.2 | |
| English Democrat | Rod Bridger | 36 | 2.4 | +2.4 | |
| Majority | 59 | 4.0 | |||
| Turnout | 1,498 | 37.4 | |||
| Conservative hold | Swing | ||||
2014-2018
edit| Party | Candidate | Votes | % | ±% | |
|---|---|---|---|---|---|
| Labour | Terry Dowling | 481 | 44.0 | −9.1 | |
| Conservative | John Rankin | 259 | 23.7 | +10.9 | |
| Independent | Clive Gross | 184 | 16.8 | +9.4 | |
| UKIP | Kevin Hill | 77 | 7.0 | −8.8 | |
| Green | Alan Dixon | 75 | 6.9 | −0.9 | |
| Liberal Democrats | Susan Tait | 17 | 1.6 | −1.5 | |
| Majority | 222 | 20.3 | |||
| Turnout | 993 | ||||
| Labour hold | Swing | ||||
| Party | Candidate | Votes | % | ±% | |
|---|---|---|---|---|---|
| Conservative | Martin Clarke | 663 | 43.5 | +3.6 | |
| Labour | Graham Crane | 557 | 36.5 | +2.1 | |
| Liberal Democrats | Gary Spencer-Holmes | 135 | 8.9 | +5.0 | |
| UKIP | Kenneth Pankhurst | 120 | 7.9 | −13.9 | |
| Green | Christopher Petts | 48 | 3.1 | NA | |
| Majority | 106 | 7.0 | |||
| Turnout | 1523 | ||||
| Conservative hold | Swing | ||||
Notes
edit- ↑ Includes totals for the predecessors of the Liberal Democrats, the Liberal Party and SDP (both of which participated in the Alliance).
- ↑ Changed from one-third to half council elections
References
edit- ↑ "Council Structure". Hastings Borough Council. Archived from the original on 16 November 2009. Retrieved 11 December 2009.
- ↑ "Election results". hastings.moderngov.co.uk. Hastings Borough Council. 17 April 2022.
- ↑ "Election results by party, 2 May 2024". 2 May 2024.
- ↑ Blakely, Joseph (8 May 2026). "The Argus".
- ↑ "Composition calculator". Colin Rallings & Michael Thrasher. The Elections Centre, Plymouth University. Retrieved 14 May 2025.
- ↑ legislation.gov.uk - The Borough of Hastings (Electoral Arrangements) Order 1978. Retrieved on 19 November 2015.
- ↑ legislation.gov.uk - The Borough of Hastings (Electoral Changes) Order 2001. Retrieved on 4 October 2015.
- ↑ The Hastings (Electoral Changes) Order 2016
- 1 2 "Tories lose battle of Hastings". The Argus. 4 May 2007. Retrieved 11 December 2009.
- ↑ "Tories hold St Helens". Sussex Express. 11 December 2009. Retrieved 11 December 2009.
- ↑ "Local Elections Archive Project — Central St Leonards Ward". www.andrewteale.me.uk. Retrieved 8 November 2024.
- ↑ "Local Elections Archive Project — St Helens Ward". www.andrewteale.me.uk. Retrieved 8 November 2024.
- By-election results Archived 29 March 2010 at the Wayback Machine