Edmonton Strathcona (formerly known as Edmonton—Strathcona) is a federal electoral district in Alberta, Canada, that has been represented in the House of Commons of Canada since 1953. It spans the south-central part of the city of Edmonton. In the periods from 2008 to 2015 and 2019 to 2021, during the 40th, 41st, and 43rd Canadian Parliaments, Edmonton Strathcona was the only federal riding in Alberta not represented by the Conservative Party.
Interactive map of riding boundaries from the 2025 federal election | |||
| Federal electoral district | |||
| Legislature | House of Commons | ||
| MP |
New Democratic | ||
| District created | 1952 | ||
| First contested | 1953 | ||
| Last contested | 2025 | ||
| District webpage | profile, map | ||
| Demographics | |||
| Population (2016)[1] | 106,066 | ||
| Electors (2019) | 77,285 | ||
| Area (km²)[2] | 80 | ||
| Pop. density (per km²) | 1,325.8 | ||
| Census division | Division No. 11 | ||
| Census subdivision | Edmonton (part) | ||
_(2022_redistribution).svg)

Geography
editEdmonton Strathcona encompasses the neighbourhoods of Allendale, Argyll, Avonmore, Belgravia, Bonnie Doon, Capilano, Cloverdale, Empire Park, Forest Heights, Fulton Place, Garneau, Gold Bar, Grandview Heights, Hazeldean, Holyrood, Idylwylde, Kenilworth, King Edward Park, Lansdowne, Lendrum Place, Malmo Plains, McKernan, Ottewell, Parkallen, Pleasantview, Queen Alexandra Park, Ritchie, Riverdale, Strathcona, Strathearn, Terrace Heights, and Windsor Park.
The riding contains the historic district of Old Strathcona, the University of Alberta, the University of Alberta Campus Saint-Jean and the Mackenzie Health Sciences Centre.
It borders on the federal ridings of Edmonton Centre, Edmonton Griesbach, Sherwood Park—Fort Saskatchewan, Edmonton Southeast, Edmonton Gateway and Edmonton Riverbend.
This district is bounded:[3]
- On the north by the North Saskatchewan River (except for a jog that goes around the neighbourhood of Riverdale, which is north of the river).
- On the west by the Whitemud Creek from the North Saskatchewan River to Whitemud Drive.
- On the south by Whitemud Drive, from Whitemud Creek to the City Limits.
- On the east by Edmonton's City Limits.
Political geography
editAs evidenced by the 2008 and 2011 elections, this riding is heavily polarized between more urban New Democratic Party (NDP) voters concentrated in the northwest of the riding and suburban Conservative voters concentrated in the south and east.
The NDP picked up this seat in 2008 for the first time in its history, when Edmonton lawyer Linda Duncan defeated Tory incumbent Rahim Jaffer, thanks to a consolidation of non-Conservative votes. They have retained the riding since and it has established itself as clearly the most left-leaning riding in Alberta. Since the 2021 federal election, Edmonton-Strathcona has been the safest NDP seat in all of Canada.
Demographics
edit- According to the 2011 Canadian census; 2013 representation[4][5]
Languages: 77.3% English, 3.8% French, 3.5% Chinese, 2.5% German, 1.5% Ukrainian, 1.3% Spanish, 1.3% Tagalog
Religions: 52.8% Christian (22.1% Catholic, 5.6% United Church, 3.5% Lutheran, 3.5% Anglican, 2.2% Baptist, 2.0% Christian Orthodox, 1.1% Pentecostal, 13.0% Other), 2.5% Muslim, 1.2% Hindu, 1.1% Buddhist, 40.6% No religion
Median income (2010): $35,026
Average income (2010): $46,710
| Panethnic group |
2021[6] | 2016[7] | 2011[8] | |||||||||||
|---|---|---|---|---|---|---|---|---|---|---|---|---|---|---|
| Pop. | % | Pop. | % | Pop. | % | |||||||||
| European[a] | 71,690 | 71.24% | 75,835 | 73.84% | 79,705 | 79.24% | ||||||||
| East Asian[b] | 6,895 | 6.85% | 7,240 | 7.05% | 5,565 | 5.53% | ||||||||
| Indigenous | 6,305 | 6.27% | 5,405 | 5.26% | 4,320 | 4.29% | ||||||||
| South Asian | 4,855 | 4.82% | 4,150 | 4.04% | 2,825 | 2.81% | ||||||||
| Southeast Asian[c] | 3,615 | 3.59% | 3,655 | 3.56% | 2,925 | 2.91% | ||||||||
| African | 2,410 | 2.39% | 2,335 | 2.27% | 1,505 | 1.5% | ||||||||
| Middle Eastern[d] | 2,180 | 2.17% | 1,955 | 1.9% | 1,840 | 1.83% | ||||||||
| Latin American | 1,500 | 1.49% | 1,385 | 1.35% | 1,185 | 1.18% | ||||||||
| Other/Multiracial[e] | 1,190 | 1.18% | 735 | 0.72% | 730 | 0.73% | ||||||||
| Total responses | 100,635 | 98.48% | 102,695 | 96.82% | 100,585 | 97.48% | ||||||||
| Total population | 102,188 | 100% | 106,066 | 100% | 103,183 | 100% | ||||||||
| Notes: Totals greater than 100% due to multiple origin responses. Demographics based on 2012 Canadian federal electoral redistribution riding boundaries. | ||||||||||||||
History
editThe Strathcona riding dates back to Territorial times (see Strathcona (federal electoral district). It was represented by Liberal MPs, then a Liberal MP who after election became a Unionist, then became a Conservative), and a United Farmer of Alberta MP in that early incarnation. (This riding was abolished in 1924, and its area was split among the Edmonton East, Edmonton West and Vegreville ridings.)
The electoral district of Edmonton—Strathcona (later Edmonton Strathcona) was created in 1952 from Edmonton East and Edmonton West ridings.
Edmonton—Strathcona gained territory from Edmonton East and was renamed "Edmonton Strathcona" during the 2012 electoral redistribution.
Historical boundaries
edit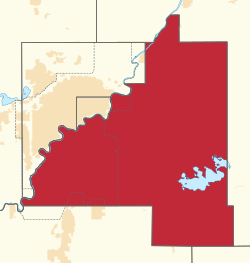 1952 representation order
 1966 representation order
 1976 representation order
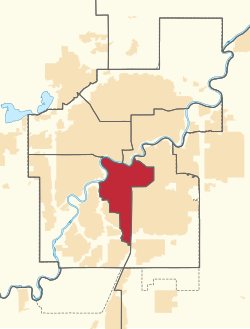 1987 representation order
 1996 representation order
 2003 representation order
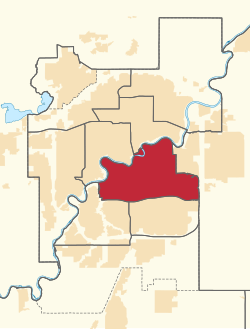 2013 representation order


Members of Parliament
editThis riding has elected the following members of the House of Commons:
| Parliament | Years | Member | Party | |
|---|---|---|---|---|
| Edmonton—Strathcona Riding created from Edmonton East and Edmonton West |
||||
| 22nd | 1953–1957 | Richmond Francis Hanna | Liberal | |
| 23rd | 1957–1958 | Sydney Herbert Thompson | Social Credit | |
| 24th | 1958–1962 | Terry Nugent | Progressive Conservative | |
| 25th | 1962–1963 | |||
| 26th | 1963–1965 | |||
| 27th | 1965–1968 | |||
| 28th | 1968–1972 | Hu Harries | Liberal | |
| 29th | 1972–1974 | Douglas Roche | Progressive Conservative | |
| 30th | 1974–1979 | |||
| 31st | 1979–1980 | David Kilgour | ||
| 32nd | 1980–1984 | |||
| 33rd | 1984–1988 | |||
| 34th | 1988–1993 | Scott Thorkelson | ||
| 35th | 1993–1997 | Hugh Hanrahan | Reform | |
| 36th | 1997–2000[nb 1] | Rahim Jaffer | ||
| 2000–2000 | Alliance | |||
| 37th | 2000–2003[nb 2] | |||
| 2003–2004 | Conservative | |||
| 38th | 2004–2006 | |||
| 39th | 2006–2008 | |||
| 40th | 2008–2011 | Linda Duncan | New Democratic | |
| 41st | 2011–2015 | |||
| Edmonton Strathcona | ||||
| 42nd | 2015–2019 | Linda Duncan | New Democratic | |
| 43rd | 2019–2021 | Heather McPherson | ||
| 44th | 2021–2025 | |||
| 45th | 2025–present | |||
Current member of Parliament
editThe current member of Parliament is Heather McPherson of the New Democratic Party who was first elected in the 2019 federal election and re-elected in the 2021 federal election. Winning 61% of the district vote in 2021, McPherson holds the largest margin of victory among elected NDP MPs in the 44th parliament.
Election results
edit View source data.
Graph of election results in Edmonton—Strathcona, Edmonton Strathcona (minor parties that never got 2% of the vote or didn't run consistently are omitted)
Edmonton Strathcona (2013–present)
edit View source data.
Graph of election results in Edmonton Strathcona (minor parties that never got 2% of the vote or didn't run consistently are omitted)
| 2025 Canadian federal election | ||||||||
|---|---|---|---|---|---|---|---|---|
| Party | Candidate | Votes | % | ±% | Expenditures | |||
| New Democratic | Heather McPherson | 28,027 | 46.96 | –10.99 | $113,792.42 | |||
| Conservative | Miles Berry | 19,768 | 33.12 | +6.35 | $47,957.55 | |||
| Liberal | Ron Thiering | 10,709 | 17.94 | +8.92 | $55,867.76 | |||
| People's | David Joel Wojtowicz | 386 | 0.65 | –3.87 | $1,213.42 | |||
| Green | Atul Deshmukh | 366 | 0.61 | –0.64 | none listed | |||
| Independent | Graham Lettner | 250 | 0.42 | – | $5,125.91 | |||
| Communist | Christian Bourque | 181 | 0.30 | – | none listed | |||
| Total valid votes/expense limit | 59,687 | 99.39 | – | $128,865.02 | ||||
| Total rejected ballots | 364 | 0.61 | +0.01 | |||||
| Turnout | 60,051 | 72.00 | +2.90 | |||||
| Eligible voters | 83,404 | |||||||
| New Democratic notional hold | Swing | –8.67 | ||||||
| Source: Elections Canada[9][10] | ||||||||
| 2021 federal election redistributed results[11] | |||
|---|---|---|---|
| Party | Vote | % | |
| New Democratic | 32,556 | 57.95 | |
| Conservative | 15,040 | 26.77 | |
| Liberal | 5,068 | 9.02 | |
| People's | 2,539 | 4.52 | |
| Green | 701 | 1.25 | |
| Others | 273 | 0.49 | |
| 2021 Canadian federal election | ||||||||
|---|---|---|---|---|---|---|---|---|
| Party | Candidate | Votes | % | ±% | Expenditures | |||
| New Democratic | Heather McPherson | 31,690 | 60.68 | +13.41 | $84,100.08 | |||
| Conservative | Tunde Obasan | 13,310 | 25.49 | –11.58 | $95,386.46 | |||
| Liberal | Hibo Mohamed | 3,948 | 7.56 | –4.06 | $22,672.65 | |||
| People's | Wes Janke | 2,366 | 4.53 | +2.87 | $4,252.77 | |||
| Green | Kelly Green | 634 | 1.21 | –0.82 | none listed | |||
| Libertarian | Malcolm Stinson | 275 | 0.53 | – | none listed | |||
| Total valid votes/expense limit | 52,223 | 99.40 | – | $108,879.96 | ||||
| Total rejected ballots | 317 | 0.60 | +0.16 | |||||
| Turnout | 52,540 | 69.10 | –3.16 | |||||
| Eligible voters | 76,037 | |||||||
| New Democratic hold | Swing | +12.50 | ||||||
| Source: Elections Canada[12][13] | ||||||||
| 2019 Canadian federal election | ||||||||
|---|---|---|---|---|---|---|---|---|
| Party | Candidate | Votes | % | ±% | Expenditures | |||
| New Democratic | Heather McPherson | 26,823 | 47.27 | +3.31 | $93,513.73 | |||
| Conservative | Sam Lilly | 21,035 | 37.07 | +5.79 | $88,211.43 | |||
| Liberal | Eleanor Olszewski | 6,592 | 11.62 | –9.11 | $90,837.85 | |||
| Green | Michael Kalmanovitch | 1,152 | 2.03 | –0.27 | $8,919.41 | |||
| People's | Ian Cameron | 941 | 1.66 | – | $1,364.69 | |||
| Communist | Naomi Rankin | 125 | 0.22 | – | $496.07 | |||
| Marxist–Leninist | Dougal MacDonald | 77 | 0.14 | –0.03 | none listed | |||
| Total valid votes/expense limit | 56,745 | 99.56 | – | $106,353.94 | ||||
| Total rejected ballots | 250 | 0.44 | +0.05 | |||||
| Turnout | 56,995 | 72.26 | +1.27 | |||||
| Eligible voters | 78,876 | |||||||
| New Democratic hold | Swing | +4.55 | ||||||
| Source: Elections Canada[14][15] | ||||||||
| 2015 Canadian federal election | ||||||||
|---|---|---|---|---|---|---|---|---|
| Party | Candidate | Votes | % | ±% | Expenditures | |||
| New Democratic | Linda Duncan | 24,446 | 43.96 | –9.75 | $87,241.42 | |||
| Conservative | Len Thom | 17,395 | 31.28 | –9.04 | $36,812.49 | |||
| Liberal | Eleanor Olszewski | 11,524 | 20.73 | +17.87 | $62,711.39 | |||
| Green | Jacob K. Binnema | 1,278 | 2.30 | –0.04 | $1,924.74 | |||
| Libertarian | Malcolm Stinson | 311 | 0.56 | – | $1,599.80 | |||
| Pirate | Ryan Bromsgrove | 201 | 0.36 | – | $1,083.76 | |||
| Rhinoceros | Donovan Eckstrom | 133 | 0.24 | – | none listed | |||
| Independent | Chris Jones | 116 | 0.21 | – | none listed | |||
| Independent | Andrew Schurman | 107 | 0.19 | – | $455.26 | |||
| Marxist–Leninist | Dougal MacDonald | 93 | 0.17 | –0.02 | none listed | |||
| Total valid votes/expense limit | 55,604 | 99.61 | – | $208,715.39 | ||||
| Total rejected ballots | 217 | 0.39 | – | |||||
| Turnout | 55,821 | 70.99 | – | |||||
| Eligible voters | 78,635 | |||||||
| New Democratic hold | Swing | –0.35 | ||||||
| Source: Elections Canada[16][17] | ||||||||
| 2011 federal election redistributed results[18] | |||
|---|---|---|---|
| Party | Vote | % | |
| New Democratic | 26,753 | 53.71 | |
| Conservative | 20,084 | 40.32 | |
| Liberal | 1,422 | 2.85 | |
| Green | 1,165 | 2.34 | |
| Others | 384 | 0.77 | |
Edmonton—Strathcona (1952-2013)
edit View source data.
Graph of election results in Edmonton—Strathcona (minor parties that never got 2% of the vote or didn't run consistently are omitted)
| 2011 Canadian federal election | ||||||||
|---|---|---|---|---|---|---|---|---|
| Party | Candidate | Votes | % | ±% | Expenditures | |||
| New Democratic | Linda Duncan | 26,093 | 53.55 | +10.96 | $83,591.54 | |||
| Conservative | Ryan Hastman | 19,762 | 40.55 | –1.05 | $77,930.25 | |||
| Liberal | Matthew Sinclair | 1,372 | 2.82 | –6.25 | $16,742.47 | |||
| Green | Andrew Fehr | 1,119 | 2.30 | –4.14 | $217.58 | |||
| Independent | Kyle Murphy | 206 | 0.42 | – | $1,915.44 | |||
| Marxist–Leninist | Kevan Hunter | 91 | 0.19 | –0.12 | none listed | |||
| Independent | Christopher White | 87 | 0.18 | – | $880.11 | |||
| Total valid votes/expense limit | 48,730 | 99.75 | – | $84,504.87 | ||||
| Total rejected ballots | 124 | 0.25 | +0.04 | |||||
| Turnout | 48,854 | 66.52 | +3.66 | |||||
| Eligible voters | 73,444 | |||||||
| New Democratic hold | Swing | +6.01 | ||||||
| Source: Elections Canada[19][20] | ||||||||
| 2008 Canadian federal election | ||||||||
|---|---|---|---|---|---|---|---|---|
| Party | Candidate | Votes | % | ±% | Expenditures | |||
| New Democratic | Linda Duncan | 20,103 | 42.58 | +10.08 | $70,896.93 | |||
| Conservative | Rahim Jaffer | 19,640 | 41.60 | –0.11 | $77,743.57 | |||
| Liberal | Claudette Roy | 4,279 | 9.06 | –8.73 | $71,903.46 | |||
| Green | Jane Thrall | 3,040 | 6.44 | +0.49 | $3,801.05 | |||
| Marxist–Leninist | Kevan Hunter | 147 | 0.31 | +0.11 | none listed | |||
| Total valid votes/expense limit | 47,209 | 99.79 | – | $82,491.89 | ||||
| Total rejected ballots | 99 | 0.21 | –0.07 | |||||
| Turnout | 47,308 | 62.86 | –5.37 | |||||
| Eligible voters | 75,254 | |||||||
| New Democratic gain from Conservative | Swing | +5.09 | ||||||
| Source: Elections Canada[21][22] | ||||||||
| 2006 Canadian federal election | ||||||||
|---|---|---|---|---|---|---|---|---|
| Party | Candidate | Votes | % | ±% | Expenditures | |||
| Conservative | Rahim Jaffer | 22,009 | 41.71 | +2.31 | $73,018.07 | |||
| New Democratic | Linda Duncan | 17,153 | 32.51 | +8.70 | $54,446.98 | |||
| Liberal | Andy Hladyshevsky | 9,391 | 17.80 | –11.22 | $72,479.99 | |||
| Green | Cameron Wakefield | 3,139 | 5.95 | –0.55 | $1,326.47 | |||
| Progressive Canadian | Michael Fedeyko | 582 | 1.10 | – | none listed | |||
| Marijuana | Dave Dowling | 390 | 0.74 | –0.33 | none listed | |||
| Marxist–Leninist | Kevan Hunter | 106 | 0.20 | –0.01 | $15.75 | |||
| Total valid votes/expense limit | 52,770 | 99.72 | – | $77,836.93 | ||||
| Total rejected ballots | 148 | 0.28 | –0.03 | |||||
| Turnout | 52,918 | 68.23 | +2.57 | |||||
| Eligible voters | 77,560 | |||||||
| Conservative hold | Swing | +5.50 | ||||||
| Source: Elections Canada[23][24] | ||||||||
| 2004 Canadian federal election | ||||||||
|---|---|---|---|---|---|---|---|---|
| Party | Candidate | Votes | % | ±% | Expenditures | |||
| Conservative | Rahim Jaffer | 19,089 | 39.40 | –11.64 | $65,390.20 | |||
| Liberal | Debby Carlson | 14,057 | 29.01 | –2.88 | $67,437.17 | |||
| New Democratic | Minister Faust | 11,535 | 23.81 | +9.02 | $44,181.99 | |||
| Green | Cameron Wakefield | 3,146 | 6.49 | – | $2,855.80 | |||
| Marijuana | Dave Dowling | 519 | 1.07 | –0.39 | none listed | |||
| Marxist–Leninist | Kevan Hunter | 103 | 0.21 | –0.08 | $26.75 | |||
| Total valid votes/expense limit | 48,449 | 99.69 | – | $74,517.10 | ||||
| Total rejected ballots | 150 | 0.31 | –0.01 | |||||
| Turnout | 48,599 | 65.66 | +2.87 | |||||
| Eligible voters | 74,014 | |||||||
| Conservative hold | Swing | +7.26 | ||||||
| Source: Elections Canada[25][26] | ||||||||
| 2000 Canadian federal election | ||||||||
|---|---|---|---|---|---|---|---|---|
| Party | Candidate | Votes | % | ±% | Expenditures | |||
| Alliance | Rahim Jaffer | 23,463 | 42.00 | +0.70 | $57,365 | |||
| Liberal | Jonathan Dai | 17,816 | 31.90 | –3.49 | $48,430 | |||
| New Democratic | Hélène Lortie-Narayana | 8,256 | 14.78 | +0.25 | $25,883 | |||
| Progressive Conservative | Gregory Toogood | 5,047 | 9.04 | +1.79 | $4,252 | |||
| Marijuana | Ken Kirk | 814 | 1.46 | – | $149 | |||
| Canadian Action | Kesa Rose Semenchuk | 299 | 0.54 | +0.35 | $1,485 | |||
| Marxist–Leninist | Kevan Hunter | 164 | 0.29 | – | $275 | |||
| Total valid votes | 55,859 | 99.68 | ||||||
| Total rejected ballots | 182 | 0.32 | +0.12 | |||||
| Turnout | 56,041 | 62.79 | +0.05 | |||||
| Eligible voters | 89,248 | |||||||
| Alliance hold | Swing | +2.10 | ||||||
| Source: Elections Canada[27][28] | ||||||||
| 1997 Canadian federal election | ||||||||
|---|---|---|---|---|---|---|---|---|
| Party | Candidate | Votes | % | ±% | Expenditures | |||
| Reform | Rahim Jaffer | 20,605 | 41.30 | +1.97 | $58,003 | |||
| Liberal | Ginette Rodger | 17,654 | 35.39 | –3.13 | $58,244 | |||
| New Democratic | Jean McBean | 7,251 | 14.53 | +9.48 | $42,936 | |||
| Progressive Conservative | Edo Nyland | 3,614 | 7.24 | –4.06 | $10,183 | |||
| Green | Karina Gregory | 406 | 0.81 | +0.24 | $520 | |||
| Natural Law | Maury Shapka | 153 | 0.31 | –0.27 | none listed | |||
| Independent | Naomi Rankin | 115 | 0.23 | +0.05 | $1,732 | |||
| Canadian Action | J. Alex Ford | 92 | 0.18 | – | $845 | |||
| Total valid votes | 49,890 | 99.80 | ||||||
| Total rejected ballots | 101 | 0.20 | –0.02 | |||||
| Turnout | 49,991 | 62.74 | –2.11 | |||||
| Eligible voters | 79,680 | |||||||
| Reform hold | Swing | +2.55 | ||||||
| Source: Elections Canada[29][30] | ||||||||
| 1993 Canadian federal election | ||||||||
|---|---|---|---|---|---|---|---|---|
| Party | Candidate | Votes | % | ±% | ||||
| Reform | Hugh Hanrahan | 19,541 | 39.33 | +17.09 | ||||
| Liberal | Chris Peirce | 19,137 | 38.52 | +20.63 | ||||
| Progressive Conservative | Scott Thorkelson | 5,617 | 11.31 | –22.16 | ||||
| New Democratic | Rita Egan | 2,513 | 5.06 | –20.26 | ||||
| National | Adrian Greenwood | 2,129 | 4.29 | – | ||||
| Green | Harry Garfinkle | 286 | 0.58 | +0.28 | ||||
| Natural Law | Maury Shapka | 284 | 0.57 | – | ||||
| Independent | Naomi Rankin | 92 | 0.19 | –0.16 | ||||
| Canada Party | Oran Johnson | 83 | 0.17 | – | ||||
| Total valid votes | 49,682 | 99.78 | ||||||
| Total rejected ballots | 112 | 0.22 | +0.00 | |||||
| Turnout | 49,794 | 64.85 | –14.86 | |||||
| Eligible voters | 76,779 | |||||||
| Reform gain | Swing | |||||||
| Source: Elections Canada[31][32][33] | ||||||||
| 1988 Canadian federal election | ||||||||
|---|---|---|---|---|---|---|---|---|
| Party | Candidate | Votes | % | ±% | ||||
| Progressive Conservative | Scott Thorkelson | 18,088 | 33.46 | –27.97 | ||||
| New Democratic | Halyna Freeland | 13,686 | 25.32 | +5.10 | ||||
| Reform | Doug Main | 12,024 | 22.25 | – | ||||
| Liberal | Una MacLean-Evans | 9,672 | 17.89 | +2.41 | ||||
| Rhinoceros | Marcel Zeeto Kotowich | 199 | 0.37 | – | ||||
| Green | Isabelle Foord | 159 | 0.29 | –0.56 | ||||
| Independent | Kevin Bruce | 86 | 0.16 | – | ||||
| Independent | Daniel P. Hermansen | 56 | 0.10 | – | ||||
| Independent | Mary Joyce | 43 | 0.08 | – | ||||
| Confederation of Regions | Thomas Roger Brown | 40 | 0.07 | –1.29 | ||||
| Total valid votes | 54,053 | 99.78 | ||||||
| Total rejected ballots | 118 | 0.22 | –0.03 | |||||
| Turnout | 54,171 | 79.71 | +11.87 | |||||
| Eligible voters | 67,962 | |||||||
| Progressive Conservative hold | Swing | –16.54 | ||||||
| Source: Elections Canada[34][35][36] | ||||||||
| 1984 Canadian federal election | ||||||||
|---|---|---|---|---|---|---|---|---|
| Party | Candidate | Votes | % | ±% | ||||
| Progressive Conservative | David Kilgour | 33,712 | 61.43 | +2.06 | ||||
| New Democratic | Doris S. Burghardt | 11,095 | 20.22 | +8.21 | ||||
| Liberal | Sandra Douglas--Tubb | 8,500 | 15.49 | –11.66 | ||||
| Confederation of Regions | Lorne Cass | 749 | 1.37 | – | ||||
| Green | Russell John Mulvey | 466 | 0.85 | – | ||||
| Social Credit | Norman Utz | 218 | 0.40 | – | ||||
| Communist | Anne McGrath | 137 | 0.25 | –0.01 | ||||
| Total valid votes | 54,877 | 99.75 | ||||||
| Total rejected ballots | 139 | 0.25 | +0.03 | |||||
| Turnout | 55,016 | 67.84 | +9.48 | |||||
| Eligible voters | 81,096 | |||||||
| Progressive Conservative hold | Swing | |||||||
| Source: Elections Canada[37][38][39] | ||||||||
| 1980 Canadian federal election | ||||||||
|---|---|---|---|---|---|---|---|---|
| Party | Candidate | Votes | % | ±% | ||||
| Progressive Conservative | David Kilgour | 23,920 | 59.38 | –0.09 | ||||
| Liberal | John Borger | 10,938 | 27.15 | –0.91 | ||||
| New Democratic | Doug Trace | 4,837 | 12.01 | –0.04 | ||||
| Rhinoceros | Dave Walker | 453 | 1.12 | – | ||||
| Communist | Joe Hill | 106 | 0.26 | –0.01 | ||||
| Marxist–Leninist | Sandy Mowat | 31 | 0.08 | –0.09 | ||||
| Total valid votes | 40,285 | 99.78 | ||||||
| Total rejected ballots | 88 | 0.22 | +0.00 | |||||
| Turnout | 40,373 | 58.36 | –9.41 | |||||
| Eligible voters | 69,180 | |||||||
| Progressive Conservative hold | Swing | +0.50 | ||||||
| Source: Elections Canada[40][41][42] | ||||||||
| 1979 Canadian federal election | ||||||||
|---|---|---|---|---|---|---|---|---|
| Party | Candidate | Votes | % | ±% | ||||
| Progressive Conservative | David Kilgour | 26,430 | 59.47 | +4.73 | ||||
| Liberal | Julian Kinisky | 12,471 | 28.06 | –2.35 | ||||
| New Democratic | Robert Davidson | 5,352 | 12.04 | +0.54 | ||||
| Communist | Joe Hill | 120 | 0.27 | –0.01 | ||||
| Marxist–Leninist | Carol Arnold | 73 | 0.16 | –0.00 | ||||
| Total valid votes | 44,446 | 99.78 | ||||||
| Total rejected ballots | 98 | 0.22 | –0.04 | |||||
| Turnout | 44,544 | 67.77 | +0.06 | |||||
| Eligible voters | 65,732 | |||||||
| Progressive Conservative hold | Swing | +3.54 | ||||||
| Source: Elections Canada[43][44][45] | ||||||||
| 1974 Canadian federal election | ||||||||
|---|---|---|---|---|---|---|---|---|
| Party | Candidate | Votes | % | ±% | ||||
| Progressive Conservative | Douglas Roche | 25,808 | 54.73 | +5.01 | ||||
| Liberal | B.C. Tanner | 14,337 | 30.41 | –0.31 | ||||
| New Democratic | Lila Fahlman | 5,426 | 11.51 | –5.30 | ||||
| Social Credit | Leif Oddson | 1,146 | 2.43 | +0.08 | ||||
| Independent | Robin Gillespie | 226 | 0.48 | – | ||||
| Communist | Harry Strynadka | 132 | 0.28 | – | ||||
| Marxist–Leninist | Margaret Peggy Askin | 79 | 0.17 | – | ||||
| Total valid votes | 47,154 | 99.74 | ||||||
| Total rejected ballots | 124 | 0.26 | –0.40 | |||||
| Turnout | 47,278 | 67.71 | –11.38 | |||||
| Eligible voters | 69,820 | |||||||
| Progressive Conservative hold | Swing | +2.66 | ||||||
| Source: Library of Parliament[46][47] | ||||||||
| 1972 Canadian federal election | ||||||||
|---|---|---|---|---|---|---|---|---|
| Party | Candidate | Votes | % | ±% | ||||
| Progressive Conservative | Douglas Roche | 26,908 | 49.72 | +11.89 | ||||
| Liberal | Hu Harries | 16,625 | 30.72 | –21.63 | ||||
| New Democratic | Howard Alfred Leeson | 9,098 | 16.81 | +9.99 | ||||
| Social Credit | Bill Pelech | 1,272 | 2.35 | – | ||||
| Independent | Elizabeth Rowley | 152 | 0.28 | –2.72 | ||||
| Independent | Peggy Morton | 63 | 0.12 | –2.88 | ||||
| Total valid votes | 54,118 | 99.34 | ||||||
| Total rejected ballots | 358 | 0.66 | +0.11 | |||||
| Turnout | 54,476 | 79.09 | +4.60 | |||||
| Eligible voters | 68,877 | |||||||
| Progressive Conservative gain from Liberal | Swing | +16.76 | ||||||
| Source: Library of Parliament[48][49] | ||||||||
| 1968 Canadian federal election | ||||||||
|---|---|---|---|---|---|---|---|---|
| Party | Candidate | Votes | % | ±% | ||||
| Liberal | Hu Harries | 21,074 | 52.35 | +22.59 | ||||
| Progressive Conservative | Terry Nugent | 15,228 | 37.83 | –0.22 | ||||
| New Democratic | Lawrence Radcliffe | 2,745 | 6.82 | –3.28 | ||||
| Independent | John R. Beatty | 1,206 | 3.00 | – | ||||
| Total valid votes | 40,253 | 99.45 | ||||||
| Total rejected ballots | 221 | 0.55 | –0.26 | |||||
| Turnout | 40,474 | 74.49 | –2.81 | |||||
| Eligible voters | 54,336 | |||||||
| Liberal gain from Progressive Conservative | Swing | +11.40 | ||||||
| Source: Library of Parliament[50][51] | ||||||||
| 1965 Canadian federal election | ||||||||
|---|---|---|---|---|---|---|---|---|
| Party | Candidate | Votes | % | ±% | ||||
| Progressive Conservative | Terry Nugent | 21,004 | 38.05 | +2.68 | ||||
| Liberal | Bill Sinclair | 16,431 | 29.77 | –0.57 | ||||
| Social Credit | Sigurd Sorenson | 11,696 | 21.19 | –4.74 | ||||
| New Democratic | Bill McLean | 5,572 | 10.10 | +1.73 | ||||
| Independent | Bill Stocks | 493 | 0.89 | – | ||||
| Total valid votes | 55,196 | 99.19 | ||||||
| Total rejected ballots | 450 | 0.81 | +0.31 | |||||
| Turnout | 55,646 | 77.30 | –3.65 | |||||
| Eligible voters | 71,989 | |||||||
| Progressive Conservative hold | Swing | +1.63 | ||||||
| Source: Library of Parliament[52][53] | ||||||||
| 1963 Canadian federal election | ||||||||
|---|---|---|---|---|---|---|---|---|
| Party | Candidate | Votes | % | ±% | ||||
| Progressive Conservative | Terry Nugent | 18,880 | 35.37 | +0.98 | ||||
| Liberal | John Decore | 16,195 | 30.34 | +4.60 | ||||
| Social Credit | Sigurd (S.A.) Sorenson | 13,841 | 25.93 | –3.22 | ||||
| New Democratic | Ian Sowton | 4,464 | 8.36 | –2.37 | ||||
| Total valid votes | 53,380 | 99.50 | ||||||
| Total rejected ballots | 266 | 0.50 | –0.27 | |||||
| Turnout | 53,646 | 80.95 | +6.07 | |||||
| Eligible voters | 66,269 | |||||||
| Progressive Conservative hold | Swing | +2.79 | ||||||
| Source: Library of Parliament[54][55] | ||||||||
| 1962 Canadian federal election | ||||||||
|---|---|---|---|---|---|---|---|---|
| Party | Candidate | Votes | % | ±% | ||||
| Progressive Conservative | Terry Nugent | 16,030 | 34.39 | –26.93 | ||||
| Social Credit | Sigurd (S.A.) Sorenson | 13,585 | 29.15 | +11.92 | ||||
| Liberal | Roy C. Marler | 11,996 | 25.74 | +8.64 | ||||
| New Democratic | Bill McLean | 5,001 | 10.73 | +6.38 | ||||
| Total valid votes | 46,612 | 99.23 | ||||||
| Total rejected ballots | 363 | 0.77 | +0.02 | |||||
| Turnout | 46,975 | 74.88 | –3.26 | |||||
| Eligible voters | 62,734 | |||||||
| Progressive Conservative hold | Swing | –19.43 | ||||||
| Source: Library of Parliament[56][57] | ||||||||
| 1958 Canadian federal election | ||||||||
|---|---|---|---|---|---|---|---|---|
| Party | Candidate | Votes | % | ±% | ||||
| Progressive Conservative | Terry Nugent | 25,885 | 61.32 | +32.73 | ||||
| Social Credit | Sydney Herbert Thompson | 7,270 | 17.22 | –18.43 | ||||
| Liberal | Richmond Francis Hanna | 7,218 | 17.10 | –12.05 | ||||
| Co-operative Commonwealth | Arnold Holmes | 1,838 | 4.35 | –2.26 | ||||
| Total valid votes | 42,211 | 99.25 | ||||||
| Total rejected ballots | 320 | 0.75 | –0.04 | |||||
| Turnout | 42,531 | 78.14 | +4.73 | |||||
| Eligible voters | 54,429 | |||||||
| Progressive Conservative gain | Swing | |||||||
| Source: Library of Parliament[58][59] | ||||||||
| 1957 Canadian federal election | ||||||||
|---|---|---|---|---|---|---|---|---|
| Party | Candidate | Votes | % | ±% | ||||
| Social Credit | Sydney Herbert Thompson | 13,124 | 35.65 | –1.05 | ||||
| Liberal | Richmond Francis Hanna | 10,731 | 29.15 | –8.18 | ||||
| Progressive Conservative | Terry Nugent | 10,525 | 28.59 | +11.77 | ||||
| Co-operative Commonwealth | Floyd Albin Johnson | 2,434 | 6.61 | –2.54 | ||||
| Total valid votes | 36,814 | 99.21 | ||||||
| Total rejected ballots | 293 | 0.79 | –0.04 | |||||
| Turnout | 37,107 | 73.41 | +12.08 | |||||
| Eligible voters | 50,546 | |||||||
| Social Credit gain | Swing | |||||||
| Source: Library of Parliament[60][61] | ||||||||
| 1953 Canadian federal election | ||||||||
|---|---|---|---|---|---|---|---|---|
| Party | Candidate | Votes | % | |||||
| Liberal | Richmond Francis Hanna | 8,901 | 37.33 | |||||
| Social Credit | Orvis A. Kennedy | 8,750 | 36.70 | |||||
| Progressive Conservative | Sidney Giffard Main | 4,012 | 16.83 | |||||
| Co-operative Commonwealth | Floyd Albin Johnson | 2,182 | 9.15 | |||||
| Total valid votes | 23,845 | 99.17 | ||||||
| Total rejected ballots | 199 | 0.83 | ||||||
| Turnout | 24,044 | 61.33 | ||||||
| Eligible voters | 39,202 | |||||||
| Source: Library of Parliament[62][63] | ||||||||
See also
editNotes
edit- ↑ Statistic includes all persons that did not make up part of a visible minority or an indigenous identity.
- ↑ Statistic includes total responses of "Chinese", "Korean", and "Japanese" under visible minority section on census.
- ↑ Statistic includes total responses of "Filipino" and "Southeast Asian" under visible minority section on census.
- ↑ Statistic includes total responses of "West Asian" and "Arab" under visible minority section on census.
- ↑ Statistic includes total responses of "Visible minority, n.i.e." and "Multiple visible minorities" under visible minority section on census.
References
edit- "Edmonton Strathcona (Code 48018) Census Profile". 2011 census. Government of Canada - Statistics Canada. Retrieved March 6, 2011.
- ↑ Statistics Canada: 2011
- ↑ Statistics Canada: 2011
- ↑ "History of Federal Ridings since 1867". Parliament of Canada. Retrieved March 27, 2011.
- ↑ "2011 Census Profile". February 8, 2012.
- ↑ "Statistics Canada: 2011 National Household Survey Profile". May 8, 2013.
- ↑ Government of Canada, Statistics Canada (October 26, 2022). "Census Profile, 2021 Census of Population". www12.statcan.gc.ca. Retrieved April 1, 2023.
- ↑ Government of Canada, Statistics Canada (October 27, 2021). "Census Profile, 2016 Census". www12.statcan.gc.ca. Retrieved April 1, 2023.
- ↑ Government of Canada, Statistics Canada (November 27, 2015). "NHS Profile". www12.statcan.gc.ca. Retrieved April 1, 2023.
- ↑ "Forty-Fifth General Election 2025 — Poll-by-poll Results: Edmonton Strathcona". elections.ca. Elections Canada. 2025.
- ↑ Canada, Chief Electoral Officer (2025). "Candidate Campaign Returns, 2025 General Election: Part 3C – Summary of Electoral Campaign Expenses and Other Outflows – Election expenses subject to the limit – Total". elections.ca. Elections Canada.
Expenses are reported "as amended" where amendments have been filed; otherwise, they are reported "as submitted".
- ↑ "Transposition of Votes from the 44th General Election to the 2023 Representation Orders". Elections Canada. Retrieved April 9, 2024.
- ↑ "Forty-Fourth General Election 2021 — Poll-by-poll Results: Edmonton Strathcona". elections.ca. Elections Canada. 2021.
- ↑ Canada, Chief Electoral Officer (2021). "Candidate Campaign Returns, 2021 General Election: Part 3C – Summary of Electoral Campaign Expenses and Other Outflows – Election expenses subject to the limit – Total". elections.ca. Elections Canada.
Expenses are reported "as amended" where amendments have been filed; otherwise, they are reported "as submitted".
- ↑ "Forty-Third General Election 2019 — Poll-by-poll Results: Edmonton Strathcona". elections.ca. Elections Canada. 2019.
- ↑ Canada, Chief Electoral Officer (2019). "Candidate Campaign Returns, 2019 General Election: Part 3C – Summary of Electoral Campaign Expenses and Other Outflows – Election expenses subject to the limit – Total". elections.ca. Elections Canada.
Expenses are reported "as amended" where amendments have been filed; otherwise, they are reported "as submitted".
- ↑ "Forty-Second General Election 2015 — Poll-by-poll Results: Edmonton Strathcona". elections.ca. Elections Canada. 2015.
- ↑ Canada, Chief Electoral Officer (2015). "Candidate Campaign Returns, 2015 General Election: Part 4 – Campaign Financial Summary – Total election expenses subject to the limit". elections.ca. Elections Canada.
Expenses are reported "as amended" where amendments have been filed; otherwise, they are reported "as submitted".
- ↑ Pundits' Guide to Canadian Elections
- ↑ "Forty-First General Election 2011 — Poll-by-poll Results: Edmonton—Strathcona". elections.ca. Elections Canada. 2011.
- ↑ Canada, Chief Electoral Officer (2011). "Candidate Campaign Returns, 2011 General Election: Part 4 – Campaign Financial Summary – Total election expenses subject to the limit". elections.ca. Elections Canada.
Expenses are reported "as amended" where amendments have been filed; otherwise, they are reported "as submitted".
- ↑ "Fortieth General Election 2008 — Poll-by-poll Results: Edmonton—Strathcona". elections.ca. Elections Canada. 2008.
- ↑ Canada, Chief Electoral Officer (2008). "Candidate Campaign Returns, 2008 General Election: Part 4 – Campaign Financial Summary – Total election expenses subject to the limit". elections.ca. Elections Canada.
Expenses are reported "as amended" where amendments have been filed; otherwise, they are reported "as submitted".
- ↑ "Thirty-Ninth General Election 2006 — Poll-by-poll Results: Edmonton—Strathcona". elections.ca. Elections Canada. 2006.
- ↑ Canada, Chief Electoral Officer (2006). "Candidate Campaign Returns, 2006 General Election: Part 4 – Campaign Financial Summary – Total election expenses subject to the limit". elections.ca. Elections Canada.
Expenses are reported "as amended" where amendments have been filed; otherwise, they are reported "as submitted".
- ↑ "Thirty-Eighth General Election 2004 — Poll-by-poll Results: Edmonton—Strathcona". elections.ca. Elections Canada. 2004.
- ↑ Canada, Chief Electoral Officer (2004). "Candidate Campaign Returns, 2004 General Election: Part 4 – Campaign Financial Summary – Total election expenses subject to the limit". elections.ca. Elections Canada.
Expenses are reported "as amended" where amendments have been filed; otherwise, they are reported "as submitted".
- ↑ Canada, Library of Parliament (2026). "Elections and Ridings: Edmonton--Strathcona, Alberta (2000)". lop.parl.ca.
- ↑ Canada, Chief Electoral Officer (2000). Thirty-Seventh General Election, 2000: Official Voting Results (Report). Ottawa: Elections Canada. ISBN 0-662-65518-4.
- ↑ Canada, Library of Parliament (2026). "Elections and Ridings: Edmonton--Strathcona, Alberta (1997)". lop.parl.ca.
- ↑ Canada, Chief Electoral Officer (1997). Thirty-Sixth General Election, 1997: Official Voting Results (Report). Ottawa: Elections Canada.
- ↑ Canada, Library of Parliament (2026). "Elections and Ridings: Edmonton--Strathcona, Alberta (1993)". lop.parl.ca.
- ↑ Canada, Chief Electoral Officer (1993). Thirty-Fifth General Election, 1993: Official Voting Results (Report). Ottawa: Elections Canada. ISBN 0-662-60097-5.
- ↑ Canada, Chief Electoral Officer (1993). Thirty-Fifth General Election, 1993: Contributions and Expenses of Registered Political Parties and Candidates (Report). Ottawa: Elections Canada. ISBN 0-662-61265-5.
- ↑ Canada, Library of Parliament (2026). "Elections and Ridings: Edmonton--Strathcona, Alberta (1988)". lop.parl.ca.
- ↑ Canada, Chief Electoral Officer (1988). Thirty-Fourth General Election, 1988: Report of the Chief Electoral Officer (Report). Ottawa: Elections Canada. ISBN 0-662-56648-3.
- ↑ Canada, Chief Electoral Officer (1988). Thirty-Fourth General Election, 1988: Report of the Chief Electoral Officer - Respecting Election Expenses (Report). Ottawa: Elections Canada. ISBN 0-662-56925-3.
- ↑ Canada, Library of Parliament (2026). "Elections and Ridings: Edmonton--Strathcona, Alberta (1984)". lop.parl.ca.
- ↑ Canada, Chief Electoral Officer (1984). Thirty-Third General Election, 1984: Report of the Chief Electoral Officer (Report). Ottawa: Queen's Printer. ISBN 0-662-53477-8.
- ↑ Canada, Chief Electoral Officer (1984). Thirty-Third General Election, 1984: Report of the Chief Electoral Officer - Respecting Election Expenses (Report). Ottawa: Queen's Printer. ISBN 0-662-53472-7.
- ↑ Canada, Library of Parliament (2026). "Elections and Ridings: Edmonton--Strathcona, Alberta (1980)". lop.parl.ca.
- ↑ Canada, Chief Electoral Officer (1980). Thirty-Second General Election, 1980: Report of the Chief Electoral Officer (Report). Ottawa: Queen's Printer. ISBN 0-660-50630-0.
- ↑ Canada, Chief Electoral Officer (1980). Thirty-Second General Election, 1980: Report of the Chief Electoral Officer - Respecting Election Expenses (Report). Ottawa: Queen's Printer. ISBN 0-662-51248-0.
- ↑ Canada, Library of Parliament (2026). "Elections and Ridings: Edmonton--Strathcona, Alberta (1979)". lop.parl.ca.
- ↑ Canada, Chief Electoral Officer (1979). Thirty-First General Election, 1979: Report of the Chief Electoral Officer (Report). Ottawa: Queen's Printer. ISBN 0-660-50445-6.
- ↑ Canada, Chief Electoral Officer (1979). Thirty-First General Election, 1979: Report of the Chief Electoral Officer - Respecting Election Expenses (Report). Ottawa: Queen's Printer. ISBN 0-662-50834-3.
- ↑ Canada, Library of Parliament (2026). "Elections and Ridings: Edmonton--Strathcona, Alberta (1974)". lop.parl.ca.
- ↑ Canada, Chief Electoral Officer (1974). Thirtieth General Election, 1974: Report of the Chief Electoral Officer (Report). Ottawa: Queen's Printer.
- ↑ Canada, Library of Parliament (2026). "Elections and Ridings: Edmonton--Strathcona, Alberta (1972)". lop.parl.ca.
- ↑ Canada, Chief Electoral Officer (1972). Twenty-Ninth General Election, 1972: Report of the Chief Electoral Officer (Report). Ottawa: Queen's Printer.
- ↑ Canada, Library of Parliament (2026). "Elections and Ridings: Edmonton--Strathcona, Alberta (1968)". lop.parl.ca.
- ↑ Canada, Chief Electoral Officer (1968). Twenty-Eighth General Election, 1968: Report of the Chief Electoral Officer (Report). Ottawa: Queen's Printer. hdl:2027/umn.31951d013775853.
- ↑ Canada, Library of Parliament (2026). "Elections and Ridings: Edmonton--Strathcona, Alberta (1965)". lop.parl.ca.
- ↑ Canada, Chief Electoral Officer (1965). Twenty-Seventh General Election, 1965: Report of the Chief Electoral Officer (Report). Ottawa: Queen's Printer. hdl:2027/umn.31951d013775845.
- ↑ Canada, Library of Parliament (2026). "Elections and Ridings: Edmonton--Strathcona, Alberta (1963)". lop.parl.ca.
- ↑ Canada, Chief Electoral Officer (1963). Twenty-Sixth General Election, 1963: Report of the Chief Electoral Officer (Report). Ottawa: Queen's Printer. hdl:2027/umn.31951d013775837.
- ↑ Canada, Library of Parliament (2026). "Elections and Ridings: Edmonton--Strathcona, Alberta (1962)". lop.parl.ca.
- ↑ Canada, Chief Electoral Officer (1962). Twenty-Fifth General Election, 1962: Report of the Chief Electoral Officer (Report). Ottawa: Queen's Printer. hdl:2027/uc1.a0004484481.
- ↑ Canada, Library of Parliament (2026). "Elections and Ridings: Edmonton--Strathcona, Alberta (1958)". lop.parl.ca.
- ↑ Canada, Chief Electoral Officer (1958). Twenty-Fourth General Election, 1958: Report of the Chief Electoral Officer (Report). Ottawa: Queen's Printer.
- ↑ Canada, Library of Parliament (2026). "Elections and Ridings: Edmonton--Strathcona, Alberta (1957)". lop.parl.ca.
- ↑ Canada, Chief Electoral Officer (1957). Twenty-Third General Election, 1957: Report of the Chief Electoral Officer (Report). Ottawa: Queen's Printer. hdl:2027/mdp.39015061584382.
- ↑ Canada, Library of Parliament (2026). "Elections and Ridings: Edmonton--Strathcona, Alberta (1953)". lop.parl.ca.
- ↑ Canada, Chief Electoral Officer (1953). Twenty-Second General Election, 1953: Report of the Chief Electoral Officer (Report). Ottawa: Queen's Printer.