
Size of this preview: 340 × 359 pixels. Other resolution: 227 × 240 pixels.
Original file (340 × 359 pixels, file size: 23 KB, MIME type: image/png)
This is a file from the Wikimedia Commons. Information from its description page there is shown below.
Commons is a freely licensed media file repository. You can help.
Commons is a freely licensed media file repository. You can help.
Summary
| Description |
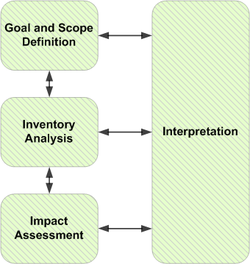
English: Graphic showing the phases of a Life Cycle Analysis. Arrows indicate that insights gained from one phase can and will influence how other phases are completed. |
| Date | |
| Source | I created this work entirely by myself. (NOTE FROM READER - this is not an accurate characterization since the graphic originally comes from the International Organization for Standardization. |
| Author | Mr3641 (talk) |
Licensing
| This work has been released into the public domain by its author, Mr3641 at English Wikipedia. This applies worldwide. In some countries this may not be legally possible; if so: Mr3641 grants anyone the right to use this work for any purpose, without any conditions, unless such conditions are required by law. |
Original upload log
The original description page was here. All following user names refer to en.wikipedia.
| Date/Time | Dimensions | User | Comment |
|---|---|---|---|
| 2008-08-12 03:07 | 340×359× (23104 bytes) | Mr3641 | {{Information |Description=Graphic showing the phases of a Life Cycle Analysis. Arrows indicate that insights gained from one phase can and will influence how other phases are completed. |Source=I created this work entirely by myself. |Date=August 12, 20 |
File history
Click on a date/time to view the file as it appeared at that time.
| Date/Time | Thumbnail | Dimensions | User | Comment | |
|---|---|---|---|---|---|
| current | 19:58, 9 June 2015 | | 340 × 359 (23 KB) | Yamaha5 | Transferred from en.wikipedia |
File usage
The following page uses this file:
Global file usage
The following other wikis use this file:
- Usage on ar.wikipedia.org
- Usage on cs.wikipedia.org
- Usage on en.wikiversity.org
- Usage on fa.wikipedia.org
- Usage on gl.wikipedia.org
- Usage on id.wikipedia.org
- Usage on pt.wikipedia.org
- Usage on www.wikidata.org