Beauport—Limoilou is a federal electoral district in Quebec City, Quebec, Canada, that has been represented in the House of Commons of Canada by Liberal Party of Canada MP Steeve Lavoie since 2025.
Interactive map of riding boundaries from the 2025 federal election | |||
| Coordinates: | 46°50′31″N 71°13′16″W / 46.842°N 71.221°W | ||
| Federal electoral district | |||
| Legislature | House of Commons | ||
| MP |
Liberal | ||
| District created | 2003 | ||
| First contested | 2004 | ||
| Last contested | 2021 | ||
| District webpage | profile, map | ||
| Demographics | |||
| Population (2016)[1] | 96,029 | ||
| Electors (2019) | 78,080 | ||
| Area (km²)[1] | 33.44 | ||
| Pop. density (per km²) | 2,871.7 | ||
| Census division | Quebec City | ||
| Census subdivision | Quebec City (part) | ||
_(2022_redistribution).svg)

The riding was created in 2003 as "Beauport" from parts of Beauport—Montmorency—Côte-de-Beaupré—Île-d'Orléans, Quebec and Quebec East ridings. It was renamed "Beauport—Limoilou" after the 2004 election.
Geography
editThe riding, in the Quebec region of Capitale-Nationale, consists of the eastern part of Quebec City, namely the boroughs of Limoilou and most of Beauport.
The neighbouring ridings are Québec, Charlesbourg—Haute-Saint-Charles, Portneuf—Jacques-Cartier, Montmorency—Charlevoix—Haute-Côte-Nord, and Lévis—Bellechasse.
This riding lost territory to Beauport—Côte-de-Beaupré—Île d'Orléans—Charlevoix and gained territory from Montmorency—Charlevoix—Haute-Côte-Nord during the 2012 electoral redistribution.
Following the 2022 Canadian federal electoral redistribution, the Chutes-Montmorency neighbourhood was united into the riding, taking in parts from Beauport—Côte-de-Beaupré—Île d'Orléans—Charlevoix. It also gained territory from Charlesbourg—Haute-Saint-Charles south of a line that follows Rue de Chamonix, 10e Av. East, and Boul. Louix-XIV; and an additional territory south of a line that follows 41e Rue West, to Boul. Henri-Bourassa to Autoroute 40.
Former boundaries
edit 2004 to 2011 elections
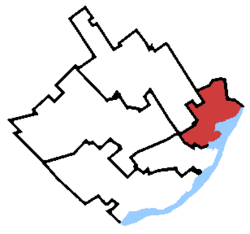 2015 to 2021 elections


Demographics
editAccording to the 2021 Canadian census, 2023 representation order[2]
Race: 88.5% White, 5.0% Black, 1.9% Indigenous, 1.5% Latin American, 1.2% Arab
Languages: 93.5% French, 2.0% English, 1.2% Spanish
Religions: 65.4% Christian (57.5% Catholic, 7.8% Other), 2.6% Muslim, 31.2% None
Median income: $40,400 (2020)
Average income: $46,040 (2020)
Members of Parliament
editThis riding has elected the following members of Parliament:
| Parliament | Years | Member | Party | |
|---|---|---|---|---|
| Beauport Riding created from Beauport—Montmorency—Côte-de-Beaupré—Île-d'Orléans, Québec and Québec East |
||||
| 38th | 2004–2006 | Christian Simard | Bloc Québécois | |
| Beauport—Limoilou | ||||
| 39th | 2006–2008 | Sylvie Boucher | Conservative | |
| 40th | 2008–2011 | |||
| 41st | 2011–2015 | Raymond Côté | New Democratic | |
| 42nd | 2015–2019 | Alupa Clarke | Conservative | |
| 43rd | 2019–2021 | Julie Vignola | Bloc Québécois | |
| 44th | 2021–2025 | |||
| 45th | 2025–present | Steeve Lavoie | Liberal | |
Election results
editThis graph was using the legacy Graph extension, which is no longer supported. It needs to be converted to the new Chart extension. |
Beauport—Limoilou
editThis graph was using the legacy Graph extension, which is no longer supported. It needs to be converted to the new Chart extension. |
| 2025 Canadian federal election | ||||||||
|---|---|---|---|---|---|---|---|---|
| Party | Candidate | Votes | % | ±% | ||||
| Liberal | Steeve Lavoie | 21,858 | 35.59 | +10.95 | ||||
| Conservative | Hugo Langlois | 18,492 | 30.11 | -0.43 | ||||
| Bloc Québécois | Julie Vignola | 17,558 | 28.59 | -2.47 | ||||
| New Democratic | Raymond Côté | 2,095 | 3.41 | -6.30 | ||||
| Green | Dalila Elhak | 924 | 1.50 | -0.53 | ||||
| People's | Andrée Massicotte | 396 | 0.64 | +0.31 | ||||
| Marxist–Leninist | Claude Moreau | 95 | 0.15 | -0.05 | ||||
| Total valid votes | 61,418 | 98.49 | ||||||
| Total rejected ballots | 939 | 1.51 | -0.72 | |||||
| Turnout | 62,357 | 68.93 | +3.51 | |||||
| Eligible voters | 90,470 | |||||||
| Liberal notional gain from Bloc Québécois | Swing | +6.71 | ||||||
| Source: Elections Canada[3][4] | ||||||||
| Note: number of eligible voters does not include voting day registrations. | ||||||||
| 2021 federal election redistributed results[5] | |||
|---|---|---|---|
| Party | Vote | % | |
| Bloc Québécois | 18,017 | 31.06 | |
| Conservative | 17,714 | 30.54 | |
| Liberal | 14,295 | 24.64 | |
| New Democratic | 5,633 | 9.71 | |
| Green | 1,183 | 2.04 | |
| Free | 813 | 1.40 | |
| People's | 193 | 0.33 | |
| Marxist-Leninist | 119 | 0.21 | |
| Independent | 43 | 0.07 | |
| Total valid votes | 58,010 | 97.78 | |
| Rejected ballots | 1,320 | 2.22 | |
| Registered voters/ estimated turnout | 59,330 | 65.41 | |
| 2021 Canadian federal election | ||||||||
|---|---|---|---|---|---|---|---|---|
| Party | Candidate | Votes | % | ±% | Expenditures | |||
| Bloc Québécois | Julie Vignola | 15,146 | 31.1 | +0.9 | $26,645.22 | |||
| Conservative | Alupa Clarke | 14,164 | 29.1 | +2.8 | $85,882.90 | |||
| Liberal | Ann Gingras | 12,378 | 25.4 | -0.5 | $59,305.19 | |||
| New Democratic | Camille Esther Garon | 5,075 | 10.4 | -0.8 | $13,578.99 | |||
| Green | Dalila Elhak | 1,025 | 2.1 | -2.1 | $1,599.40 | |||
| Free | Lyne Verret | 737 | 1.5 | N/A | $416.50 | |||
| Marxist–Leninist | Claude Moreau | 119 | 0.2 | ±0.0 | $0.00 | |||
| Total valid votes/expense limit | 48,644 | 97.8 | – | $109,164.00 | ||||
| Total rejected ballots | 1,134 | 2.2 | ||||||
| Turnout | 49,778 | 65.0 | ||||||
| Registered voters | 76,607 | |||||||
| Bloc Québécois hold | Swing | -1.0 | ||||||
| Source: Elections Canada[6] | ||||||||
| 2019 Canadian federal election | ||||||||
|---|---|---|---|---|---|---|---|---|
| Party | Candidate | Votes | % | ±% | Expenditures | |||
| Bloc Québécois | Julie Vignola | 15,149 | 30.18 | +15.41 | none listed | |||
| Conservative | Alupa Clarke | 13,185 | 26.27 | -4.31 | $83,296.15 | |||
| Liberal | Antoine Bujold | 13,020 | 25.94 | +0.52 | $68,905.79 | |||
| New Democratic | Simon-Pierre Beaudet | 5,599 | 11.16 | -14.32 | $9,394.55 | |||
| Green | Dalila Elhak | 2,127 | 4.24 | +1.82 | $1,410.36 | |||
| People's | Alicia Bédard | 1,033 | 2.06 | – | none listed | |||
| Marxist–Leninist | Claude Moreau | 78 | 0.16 | -0.10 | $0.00 | |||
| Total valid votes/expense limit | 50,191 | 97.53 | ||||||
| Total rejected ballots | 1,272 | 2.47 | +0.64 | |||||
| Turnout | 51,463 | 65.91 | +0.56 | |||||
| Eligible voters | 78,080 | |||||||
| Bloc Québécois gain from Conservative | Swing | +9.86 | ||||||
| Source: Elections Canada[7][8] | ||||||||
| 2015 Canadian federal election | ||||||||
|---|---|---|---|---|---|---|---|---|
| Party | Candidate | Votes | % | ±% | Expenditures | |||
| Conservative | Alupa Clarke | 15,461 | 30.58 | +5.30 | $67,512.75 | |||
| New Democratic | Raymond Côté | 12,881 | 25.48 | -20.42 | $81,796.66 | |||
| Liberal | Antoine Bujold | 12,854 | 25.42 | +19.06 | $36,012.79 | |||
| Bloc Québécois | Doni Berberi | 7,467 | 14.77 | -5.37 | $10,571.92 | |||
| Green | Dalila Elhak | 1,220 | 2.41 | +0.55 | $1,343.81 | |||
| Libertarian | Francis Bedard | 423 | 0.84 | – | $2,392.63 | |||
| Marxist–Leninist | Claude Moreau | 128 | 0.25 | +0.02 | – | |||
| Strength in Democracy | Bladimir Laborit | 124 | 0.25 | – | $1,075.02 | |||
| Total valid votes/expense limit | 50,558 | 98.17 | $213,227.46 | |||||
| Total rejected ballots | 941 | 1.83 | – | |||||
| Turnout | 51,499 | 65.35 | – | |||||
| Eligible voters | 78,799 | |||||||
| Conservative gain from New Democratic | Swing | +12.86 | ||||||
| Source: Elections Canada[9][10] | ||||||||
| 2011 federal election redistributed results[11] | |||
|---|---|---|---|
| Party | Vote | % | |
| New Democratic | 21,845 | 45.90 | |
| Conservative | 12,030 | 25.28 | |
| Bloc Québécois | 9,585 | 20.14 | |
| Liberal | 3,024 | 6.35 | |
| Green | 885 | 1.86 | |
| Others | 220 | 0.46 | |
| 2011 Canadian federal election | ||||||||
|---|---|---|---|---|---|---|---|---|
| Party | Candidate | Votes | % | ±% | Expenditures | |||
| New Democratic | Raymond Côté | 24,306 | 46.07 | +33.85 | ||||
| Conservative | Sylvie Boucher | 13,845 | 26.24 | -10.52 | ||||
| Bloc Québécois | Michel Létourneau | 10,250 | 19.43 | -13.18 | ||||
| Liberal | Lorraine Chartier | 3,162 | 5.99 | -8.37 | ||||
| Green | Louise Courville | 950 | 1.80 | -0.98 | ||||
| Christian Heritage | Anne-Marie Genest | 124 | 0.24 | - | ||||
| Marxist–Leninist | Claude Moreau | 122 | 0.23 | - | ||||
| Total valid votes/expense limit | 52,759 | 100.00 | ||||||
| Total rejected ballots | 843 | 1.57 | -0.14 | |||||
| Turnout | 53,602 | 63.26 | +3.86 | |||||
| Eligible voters | 84,738 | – | – | |||||
| 2008 Canadian federal election | ||||||||
|---|---|---|---|---|---|---|---|---|
| Party | Candidate | Votes | % | ±% | Expenditures | |||
| Conservative | Sylvie Boucher | 17,994 | 36.76 | -2.68 | $48,176 | |||
| Bloc Québécois | Éléonore Mainguy | 15,962 | 32.61 | -5.26 | $28,254 | |||
| Liberal | Yves Picard | 7,030 | 14.36 | +4.32 | $19,558 | |||
| New Democratic | Simon-Pierre Beaudet | 5,986 | 12.22 | +4.24 | $4,297 | |||
| Green | Luc Côté | 1,363 | 2.78 | -1.30 | $0 | |||
| Independent | Simon Bédard | 610 | 1.23 | – | – | $5,911 | ||
| Total valid votes/expense limit | 48,945 | 100.00 | $87,843 | |||||
| Total rejected ballots | 849 | 1.71 | ||||||
| Turnout | 49,794 | 59.40 | ||||||
| Conservative hold | Swing | +1.29 | ||||||
| 2006 Canadian federal election | ||||||||
|---|---|---|---|---|---|---|---|---|
| Party | Candidate | Votes | % | ±% | Expenditures | |||
| Conservative | Sylvie Boucher | 19,409 | 39.54 | +23.59 | $46,042 | |||
| Bloc Québécois | Christian Simard | 18,589 | 37.87 | -11.78 | $47,991 | |||
| Liberal | Yves Picard | 4,929 | 10.04 | -15.59 | $29,000 | |||
| New Democratic | Simon-Pierre Beaudet | 3,917 | 7.98 | +3.89 | $3,095 | |||
| Green | Mario Laprise | 2,005 | 4.08 | +0.68 | $1,097 | |||
| Marijuana | Jean Bedard | 234 | 0.47 | -0.79 | ||||
| Total valid votes/expense limit | 49,081 | 100.00 | $82,093 | |||||
Beauport
edit| 2004 Canadian federal election | ||||||||
|---|---|---|---|---|---|---|---|---|
| Party | Candidate | Votes | % | ±% | Expenditures | |||
| Bloc Québécois | Christian Simard | 22,989 | 49.65 | – | $44,941 | |||
| Liberal | Dennis Dawson | 11,866 | 25.63 | – | $60,945 | |||
| Conservative | Stephan Asselin | 7,388 | 15.96 | – | $6,879 | |||
| New Democratic | Xavier Trégan | 1,896 | 4.09 | – | $621 | |||
| Green | Jeannine T. Desharnais | 1,577 | 3.41 | – | $252 | |||
| Marijuana | Nicolas Frichot | 585 | 1.26 | – | ||||
| Total valid votes/expense limit | 46,301 | 100.00 | $81,041 | |||||
See also
editReferences
edit- "Beauport—Limoilou (Code 24007) Census Profile". 2011 census. Government of Canada - Statistics Canada. Retrieved March 7, 2011.
- Campaign expense data from Elections Canada
- 2011 Results from Elections Canada
- Riding history for Beauport from the Library of Parliament
- Riding history for Beauport—Limoilou from the Library of Parliament
Notes
edit- 1 2 Statistics Canada: 2016
- ↑ Government of Canada, Statistics Canada (August 2, 2024). "Profile table, Census Profile, 2021 Census of Population - Beauport--Limoilou [Federal electoral district (2023 Representation Order)], Quebec". www12.statcan.gc.ca. Retrieved June 4, 2025.
- ↑ "Voter information service". Elections Canada. Retrieved May 3, 2025.
- ↑ "Election Night Results - Electoral Districts". Elections Canada. Retrieved June 4, 2025.
- ↑ "Transposition of Votes from the 44th General Election to the 2023 Representation Orders". Elections Canada. Retrieved April 9, 2024.
- ↑ "Confirmed candidates — Beauport—Limoilou". Elections Canada. Retrieved September 20, 2021.
- ↑ "List of confirmed candidates". Elections Canada. Retrieved October 3, 2019.
- ↑ "Official Voting Results". Elections Canada. Retrieved July 17, 2021.
- ↑ Elections Canada – Confirmed candidates for Beauport—Limoilou, 30 September 2015
- ↑ Elections Canada – Preliminary Election Expenses Limits for Candidates Archived 2015-08-15 at the Wayback Machine
- ↑ Pundits' Guide to Canadian Elections