Basingstoke and Deane Borough Council elections
(Redirected from Basingstoke and Deane local elections)
One third of Basingstoke and Deane Borough Council in Hampshire, England is elected each year, followed by one year without election. Since the last boundary changes in 2021, 54 councillors have been elected from 18 wards.
Election results
edit| Year | Conservative | Labour | Liberal Democrats[a] | BDI | Green[b] | Independents & Others |
Council control after election | |
|---|---|---|---|---|---|---|---|---|
| Local government reorganisation; council established (54 seats) | ||||||||
| 1973 | 21 | 14 | 3 | – | – | 16 | No overall control | |
| New ward boundaries (59 seats) | ||||||||
| 1976 | 35 | 14 | 1 | – | 0 | 9 | Conservative | |
| 1978 | 36 | 14 | 2 | – | 0 | 7 | Conservative | |
| 1979 | 37 | 14 | 3 | – | 0 | 5 | Conservative | |
| 1980 | 34 | 17 | 3 | – | 0 | 5 | Conservative | |
| 1982 | 26 | 22 | 4 | – | 0 | 7 | No overall control | |
| 1983 | 28 | 22 | 3 | – | 0 | 6 | No overall control | |
| 1984 | 29 | 19 | 4 | – | 0 | 7 | No overall control | |
| 1986 | 32 | 17 | 5 | – | 0 | 5 | Conservative | |
| 1987 | 32 | 14 | 9 | – | 0 | 4 | Conservative | |
| 1988 | 33 | 13 | 9 | – | 0 | 4 | Conservative | |
| 1990 | 31 | 15 | 10 | – | 0 | 3 | Conservative | |
| 1991 | 30 | 14 | 12 | – | 0 | 3 | Conservative | |
| New ward boundaries (59 seats) | ||||||||
| 1992 | 35 | 11 | 9 | – | 0 | 2 | Conservative | |
| 1994 | 28 | 11 | 13 | – | 0 | 5 | No overall control | |
| 1995 | 25 | 13 | 15 | – | 0 | 4 | No overall control | |
| 1996 | 23 | 14 | 17 | – | 0 | 3 | No overall control | |
| 1998 | 25 | 15 | 13 | – | 0 | 4 | No overall control | |
| 1999 | 24 | 15 | 14 | – | 0 | 4 | No overall control | |
| 2000 | 24 | 15 | 15 | – | 0 | 3 | No overall control | |
| New ward boundaries (62 seats) | ||||||||
| 2002 | 25 | 15 | 17 | – | 0 | 3 | No overall control | |
| 2003 | 26 | 15 | 15 | – | 0 | 4 | No overall control | |
| 2004 | 28 | 12 | 16 | – | 0 | 4 | No overall control | |
| 2006 | 31 | 11 | 15 | – | 0 | 3 | Conservative | |
| 2007 | 31 | 11 | 15 | – | 0 | 3 | Conservative | |
| New ward boundaries (60 seats) | ||||||||
| 2008 | 35 | 9 | 14 | – | 0 | 2 | Conservative | |
| 2010 | 34 | 11 | 13 | – | 0 | 3 | Conservative | |
| 2011 | 34 | 11 | 13 | – | 0 | 2 | Conservative | |
| 2012 | 32 | 14 | 11 | – | 0 | 3 | Conservative | |
| 2014 | 28 | 17 | 9 | – | 0 | 6[c] | No overall control | |
| 2015 | 32 | 17 | 7 | – | 0 | 4[d] | Conservative | |
| 2016 | 33 | 19 | 6 | – | 0 | 2[e] | Conservative | |
| 2018 | 33 | 21 | 5 | – | 0 | 1 | Conservative | |
| 2019 | 33 | 21 | 7 | – | 0 | 1 | Conservative | |
| New ward boundaries (54 seats) | ||||||||
| 2021 | 33 | 10 | 5 | 5 | 0 | 1 | Conservative | |
| 2022 | 29 | 10 | 7 | 8 | 0 | 0 | Conservative | |
| 2023 | 23 | 10 | 9 | 8 | 1 | 3 | No overall control | |
| 2024 | 16 | 11 | 11 | 10 | 2 | 4[f] | No overall control | |
| 2026 | 11 | 10 | 11 | 12 | 2 | 7[g] | No overall control | |
Borough result maps
edit 2002 results map
 2003 results map
 2004 results map
 2006 results map
 2007 results map
 2008 results map
 2010 results map
 2011 results map
 2012 results map
 2014 results map
 2015 results map
 2016 results map
 2018 results map
 2019 results map
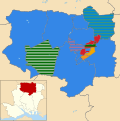 2021 results map
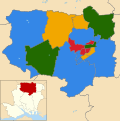 2022 results map
 2023 results map
 2024 results map
 2026 results map


By-election results
edit1994-1998
edit| Party | Candidate | Votes | % | ±% | |
|---|---|---|---|---|---|
| Conservative | 683 | 36.0 | |||
| Liberal Democrats | 646 | 34.0 | |||
| Labour | 409 | 21.9 | |||
| Independent | 152 | 8.0 | |||
| Independent | 7 | 0.4 | |||
| Majority | 37 | 2.0 | |||
| Turnout | 1,897 | 43.4 | |||
| Conservative hold | Swing | ||||
| Party | Candidate | Votes | % | ±% | |
|---|---|---|---|---|---|
| Labour | 892 | 77.4 | |||
| Conservative | 195 | 16.9 | |||
| Liberal Democrats | 65 | 5.6 | |||
| Majority | 697 | 60.5 | |||
| Turnout | 1,152 | 21.0 | |||
| Labour hold | Swing | ||||
| Party | Candidate | Votes | % | ±% | |
|---|---|---|---|---|---|
| Labour | 706 | 65.9 | |||
| Liberal Democrats | 172 | 16.1 | |||
| Conservative | 168 | 15.7 | |||
| Independent | 25 | 2.3 | |||
| Majority | 534 | 49.8 | |||
| Turnout | 1,071 | 19.6 | |||
| Labour hold | Swing | ||||
| Party | Candidate | Votes | % | ±% | |
|---|---|---|---|---|---|
| Labour | 653 | 66.6 | +0.7 | ||
| Conservative | 253 | 25.8 | +10.1 | ||
| Liberal Democrats | 75 | 7.6 | −8.5 | ||
| Majority | 400 | 40.8 | |||
| Turnout | 981 | 17.9 | −1.7 | ||
| Labour hold | Swing | ||||
1998-2002
edit| Party | Candidate | Votes | % | ±% | |
|---|---|---|---|---|---|
| Labour | 1,503 | 45.8 | +5.0 | ||
| Conservative | 1,243 | 37.9 | +8.4 | ||
| Liberal Democrats | 532 | 16.0 | +2.0 | ||
| Majority | 260 | 7.9 | |||
| Turnout | 3,278 | ||||
| Labour hold | Swing | ||||
2006-2010
edit| Party | Candidate | Votes | % | ±% | |
|---|---|---|---|---|---|
| Conservative | Robert Taylor | 332 | 47.1 | +15.2 | |
| Labour | Gill Gleeson | 210 | 29.8 | −19.0 | |
| Liberal Democrats | Stephen Day | 123 | 17.4 | +17.4 | |
| Green | Matthew Pinto | 40 | 5.7 | +5.7 | |
| Majority | 122 | 17.3 | |||
| Turnout | 705 | 22.1 | |||
| Conservative gain from Labour | Swing | ||||
| Party | Candidate | Votes | % | ±% | |
|---|---|---|---|---|---|
| Conservative | Karen Cherrett | 156 | 52.7 | −10.9 | |
| Liberal Democrats | Andrew Hood | 122 | 41.2 | +4.8 | |
| Labour | Warwick Dady | 18 | 6.1 | +6.1 | |
| Majority | 34 | 11.5 | |||
| Turnout | 296 | 33.7 | |||
| Conservative hold | Swing | ||||
| Party | Candidate | Votes | % | ±% | |
|---|---|---|---|---|---|
| Liberal Democrats | Eric Dunlop | 858 | 52.8 | −5.6 | |
| Conservative | Bill Judge | 709 | 43.6 | +2.0 | |
| Labour | James Gibb | 58 | 3.6 | +3.6 | |
| Majority | 149 | 9.2 | |||
| Turnout | 1,125 | 42.5 | |||
| Liberal Democrats hold | Swing | ||||
| Party | Candidate | Votes | % | ±% | |
|---|---|---|---|---|---|
| Liberal Democrats | Michael Bound | 428 | 53.8 | +20.3 | |
| Conservative | Zoe Wheddon | 368 | 46.2 | −20.3 | |
| Majority | 60 | 7.6 | |||
| Turnout | 796 | 40.6 | |||
| Liberal Democrats gain from Conservative | Swing | ||||
| Party | Candidate | Votes | % | ±% | |
|---|---|---|---|---|---|
| Conservative | Paul Miller | 898 | 63.0 | +19.1 | |
| Liberal Democrats | Liam Elvish | 249 | 17.5 | +7.7 | |
| Independent | Josephine Walke | 163 | 11.4 | −29.5 | |
| Labour | Simon Broad | 98 | 6.9 | +1.4 | |
| Independent | Tracy Cross | 18 | 1.3 | +1.3 | |
| Majority | 649 | 45.5 | |||
| Turnout | 1,426 | 21.1 | |||
| Conservative hold | Swing | ||||
2014-2018
edit| Party | Candidate | Votes | % | ±% | |
|---|---|---|---|---|---|
| Conservative | Paul Gaskell | 1,051 | 67.5 | +3.7 | |
| Liberal Democrats | Richard Lilleker | 323 | 20.7 | +8.3 | |
| Labour | Andrew Toal | 184 | 11.8 | −0.1 | |
| Majority | 728 | 46.7 | |||
| Turnout | 1,558 | ||||
| Conservative hold | Swing | -2.3 | |||
| Party | Candidate | Votes | % | ±% | |
|---|---|---|---|---|---|
| Conservative | Kerri Carruthers | 456 | 49.2 | −12.1 | |
| Liberal Democrats | Josephine Slimin | 342 | 36.9 | +13.8 | |
| Labour | Claire Ballard | 88 | 9.5 | −6.1 | |
| UKIP | Philip Heath | 41 | 4.4 | +4.4 | |
| Majority | 114 | 12.3 | |||
| Turnout | 927 | ||||
| Conservative hold | Swing | -13.0 | |||
| Party | Candidate | Votes | % | ±% | |
|---|---|---|---|---|---|
| Labour | Angie Freeman | 824 | 61.6 | +31.2 | |
| Conservative | Chris Hendon | 472 | 35.3 | −10.5 | |
| Liberal Democrats | Zoe-Marie Rogers | 42 | 3.1 | −2.7 | |
| Majority | 352 | 26.3 | |||
| Turnout | 1338 | ||||
| Labour gain from Conservative | Swing | ||||
| Party | Candidate | Votes | % | ±% | |
|---|---|---|---|---|---|
| Conservative | Tomy Capon | 686 | 58.9 | −5.6 | |
| Labour | Grant Donohoe | 366 | 31.4 | +12.3 | |
| Liberal Democrats | Stavroulla O'Doherty | 113 | 9.7 | +9.7 | |
| Majority | 320 | 27.5 | |||
| Turnout | 1,165 | ||||
| Conservative hold | Swing | ||||
2018-2022
edit| Party | Candidate | Votes | % | ±% | |
|---|---|---|---|---|---|
| Conservative | Anne Court | 884 | 60.4 | −6.4 | |
| Labour | Alex Lee | 475 | 32.4 | +11.2 | |
| Liberal Democrats | Stavroulla O'Doherty | 105 | 7.2 | −4.8 | |
| Majority | 409 | 27.9 | |||
| Turnout | 1,464 | ||||
| Conservative hold | Swing | ||||
| Party | Candidate | Votes | % | ±% | |
|---|---|---|---|---|---|
| Labour | Carolyn Wooldridge | 925 | 68.2 | +2.6 | |
| Conservative | Michael Archer | 288 | 21.2 | −2.5 | |
| Independent | Phil Heath | 80 | 5.9 | +5.9 | |
| Liberal Democrats | Zoe Rogers | 64 | 4.7 | −0.2 | |
| Majority | 637 | 46.9 | |||
| Turnout | 1,357 | ||||
| Labour hold | Swing | ||||
| Party | Candidate | Votes | % | ±% | |
|---|---|---|---|---|---|
| Independent | Chris Tomblin | 800 | 57.2 | +57.2 | |
| Conservative | Angus Groom | 449 | 32.1 | −24.1 | |
| Independent | Joyce Bowyer | 150 | 10.7 | +10.7 | |
| Majority | 351 | 25.1 | |||
| Turnout | 1,399 | ||||
| Independent gain from Conservative | Swing | ||||
References
edit- ↑ Includes totals for the predecessors of the Liberal Democrats, the Liberal Party and SDP (both of which participated in the Alliance).
- ↑ Includes totals for the predecessors of the Green Party of England and Wales, the Ecology Party and Green Party UK.
- ↑ 5 Independent, 1 UKIP
- ↑ 3 Independents, 1 UKIP
- ↑ 1 Independent, 1 UKIP
- ↑ 3 Independents, 1 Women's Equality
- ↑ 3 Independents, 2 All In Party, 2 Reform
- ↑ "Composition calculator". Colin Rallings & Michael Thrasher. The Elections Centre, Plymouth University. Retrieved 14 May 2025.
- ↑ "Tories take control of Basingstoke and Deane Borough Council". 24dash.com. 22 December 2006. Archived from the original on 15 July 2009. Retrieved 17 October 2009.
- ↑ "Buckskin Ward By-Election". Basingstoke and Deane. Archived from the original on 11 October 2008. Retrieved 17 October 2009.
- ↑ "Rooksdown Ward By-Election". Basingstoke and Deane. Archived from the original on 20 November 2008. Retrieved 17 October 2009.
- ↑ "Whitchurch Ward By-Election". Basingstoke and Deane. Archived from the original on 21 November 2008. Retrieved 17 October 2009.
- ↑ "Tories lose overall control of borough council". Southern Daily Echo. 25 January 2008. Archived from the original on 22 August 2011. Retrieved 17 October 2009.
- ↑ "Result of Chineham by-election". Basingstoke and Deane. 16 October 2009. Retrieved 17 October 2009.[permanent dead link]
- ↑ "Tories win by-election". Basingstoke Gazette. 16 October 2009. Archived from the original on 20 July 2011. Retrieved 17 October 2009.
- ↑ "Local Elections Archive Project — Basing Ward". www.andrewteale.me.uk. Retrieved 20 March 2024.
- ↑ "Local Elections Archive Project — Tadley South Ward". www.andrewteale.me.uk. Retrieved 20 March 2024.
- ↑ "Local Elections Archive Project — Winklebury Ward". www.andrewteale.me.uk. Retrieved 20 March 2024.
- ↑ "Local Elections Archive Project — Kempshott Ward". www.andrewteale.me.uk. Retrieved 20 March 2024.
- ↑ "Local Elections Archive Project — Kempshott Ward". www.andrewteale.me.uk. Retrieved 20 March 2024.
- ↑ "Local Elections Archive Project — Norden Ward". www.andrewteale.me.uk. Retrieved 20 March 2024.
- ↑ "Local Elections Archive Project — Bramley and Sherfield Ward". www.andrewteale.me.uk. Retrieved 20 March 2024.
- By-election results Archived 29 March 2010 at the Wayback Machine